


Power Apps
Rapid business application development
Power Automate
Business process automation
Copilot Studio
Custom virtual agent development
Power Pages
Fast website development
With Power BI you get a clear view of your business in real time, and make even smarter decisions. It allows you to visualize your information and easily integrate it into the applications you already use.
Data is no longer only useful for finance executives and data analysts. With Power BI and Copilot’s artificial intelligence, every employee harnesses the power of data.
With AI, by asking simple questions in natural language, he can draw useful conclusions for his work without specialized knowledge of data analytics.
Through easy-to-understand graphs and reports, they get the information they need to make better decisions and improve their work.
Connect and integrate every source (CRM, ERP, etc.) to a central hub for a complete and reliable view of your business.
Turn numbers into dynamic, easy-to-read charts that reveal opportunities and trends.
Create and share reports with a few clicks, improving collaboration and decision-making.
Extract valuable insights about your data with Copilot’s advanced artificial intelligence
Extend the capabilities of Power BI by seamlessly integrating it with tools such as Teams, PowerPoint, Excel and Power Platform apps.
Start benefiting from Power BI immediately, with hundreds of ready-made templates, AI report generation and easy creation tools.
With Power BI and artificial intelligence, you unlock insights that you can use immediately to make smarter decisions with real impact for your business.
You understand your different customer segments in depth and accurately forecast future demand.
You identify patterns in the data, hidden costs as well as the real sources of profit, and make efficient forecasts, reducing costs and increasing profits.
Collaborate seamlessly with your colleagues and share reports quickly through Microsoft 365 apps.
Reduce errors in data analysis and create understandable reports faster.
Gather all your data in one place, regardless of the source, and make real-time, data-driven decisions.
Adapting Power BI to reporting needs is a challenge for most companies. Verus+, with over 15 years of experience in Microsoft technologies, has been leveraging Power BI, as well as the rest of the Power Platform solutions, for years, solving real problems for its partners. Contact us to analyze your needs and together we can design the ideal plan for implementing data analytics software in your business.
We customize Power BI based on your business needs so you can quickly start analyzing your data. We turn complex numbers into custom reports and dashboards that speak the language of your business.
We fully train your staff and ensure that your users get the most out of Power BI. We always stay by your side and solve any problems or questions that arise regarding your data analysis.
We aggregate data in Power BI from all the systems you use, such as your ERP, CRM, e-shop or any database, so you can find all the information in one place and analyze your data with ease.
We leverage our years of experience in analyzing and redesigning business processes and suggest the smartest ways to leverage Power BI to draw valuable insights and improve your processes.
Harness the power of data in every aspect of your business by integrating Power BI into Dynamics 365 Business Central
Here are a few ways it is integrated into Microsoft 365 applications:
Collaborate better using Power BI from within Teams. Share reports with a few clicks, edit them and make smarter decisions in less time.
Easily integrate your reports into your PowerPoint presentations. Go to more detailed, live reports within Power BI with just a few clicks.
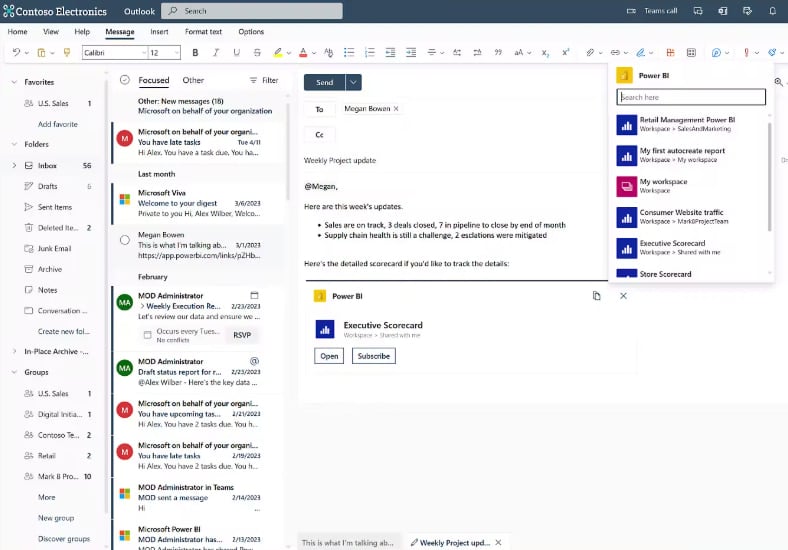
Create reports and dashboards quickly within Outlook, and easily share them with your colleagues.
Share and edit Excel data in Power BI and vice versa. Visualize your data and make analysis easier with Power BI graphs and tables.
Some concrete examples of how data analysis software is applied in various industries:
Quickly get a comprehensive view of the business in real time, through easy-to-read charts and dashboards. Identify growth opportunities, monitor revenue flow and make better strategic decisions.
It connects to all data sources, allowing data analysts to gather and analyse large volumes of information in a single environment. Tools such as Power Query and DAX language provide flexibility in data enrichment, while interactive reports help present complex statistical findings in an understandable way.
Even without specialized data analytics skills, employees are leveraging easy-to-read dashboards and artificial intelligence to track KPIs and identify trends or problems in a timely manner. The ability to share reports makes it easier to collaborate and make faster, more informed decisions.
Fill in the form and one of our qualified consultants will contact you directly to arrange an appointment at which:
Rapid business application development
Business process automation
Custom virtual agent development
Fast website development
Power BI is a Microsoft business intelligence (BI) platform that enables the collection, analysis and visualization of data through interactive reports and dashboards.
Power BI is used for:
No, Power BI and Excel serve different purposes:
Power BI has a free version (Power BI Desktop) and subscription versions such as Power BI Pro (9.40€ per month/user) and Power BI Premium (18.70€ per month/user) for enterprises.
No, programming is not required for basic use. However, it does support languages such as:
No, Power BI complements Excel instead of replacing it, offering better visualization and automation of reports.
Power BI is included in the Microsoft 365 E5 EOX subscription, at a cost of €57.70 per month per user. But it is a complete subscription with dozens of 365 applications, as well as other Power Platform solutions (Power Apps, Power Automate).
Yes, users can: